Funding Comparison
Objective: Gain an understanding of the Funding Comparison report
To load the Funding Comparison in the Web App, users log in with their Predictor account and select the Workspace.
Once the Workspace is loaded, users can click on the 'Advanced Comparison' tab to view the Advanced Reports.
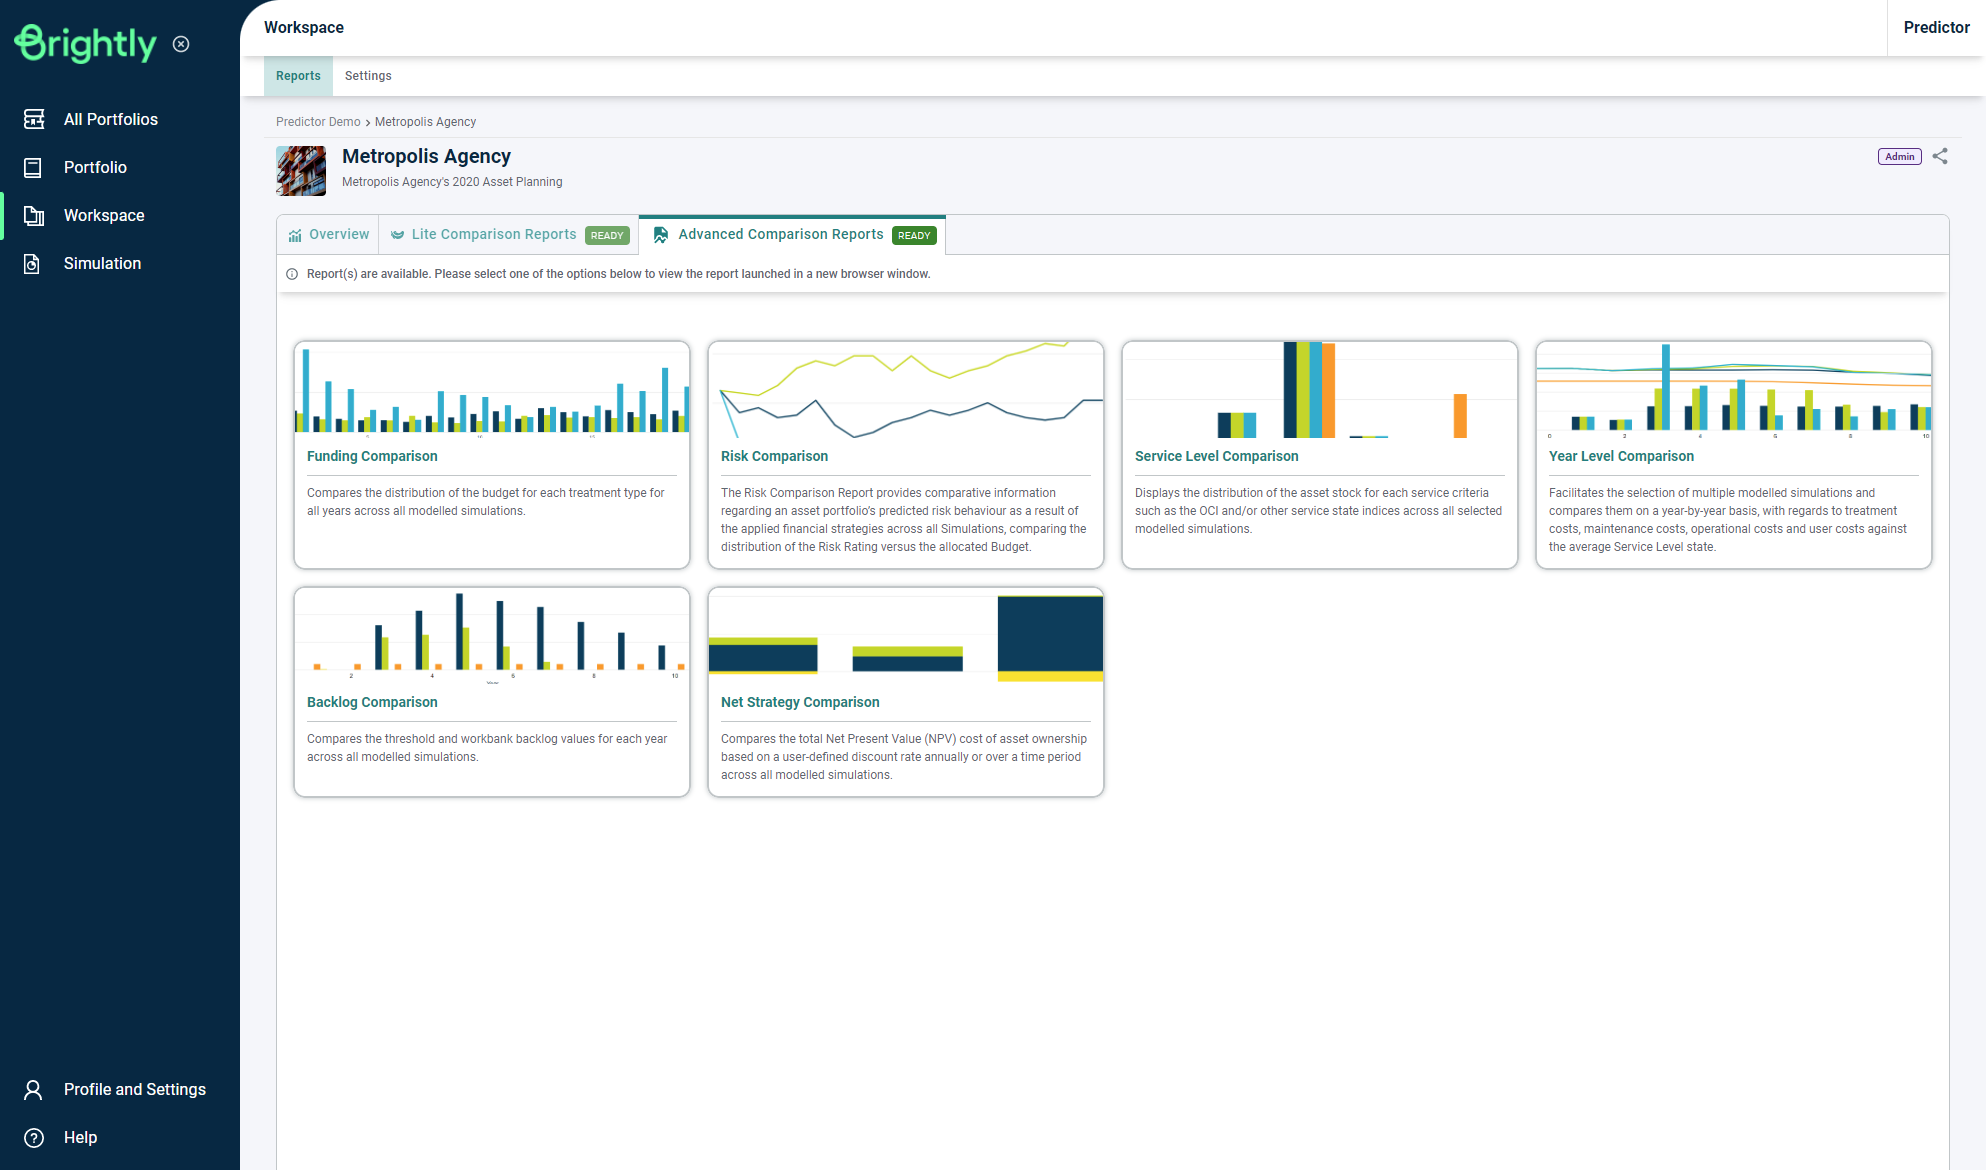
Users can then click the 'Funding Comparison' button to load the Report in a new browser tab:
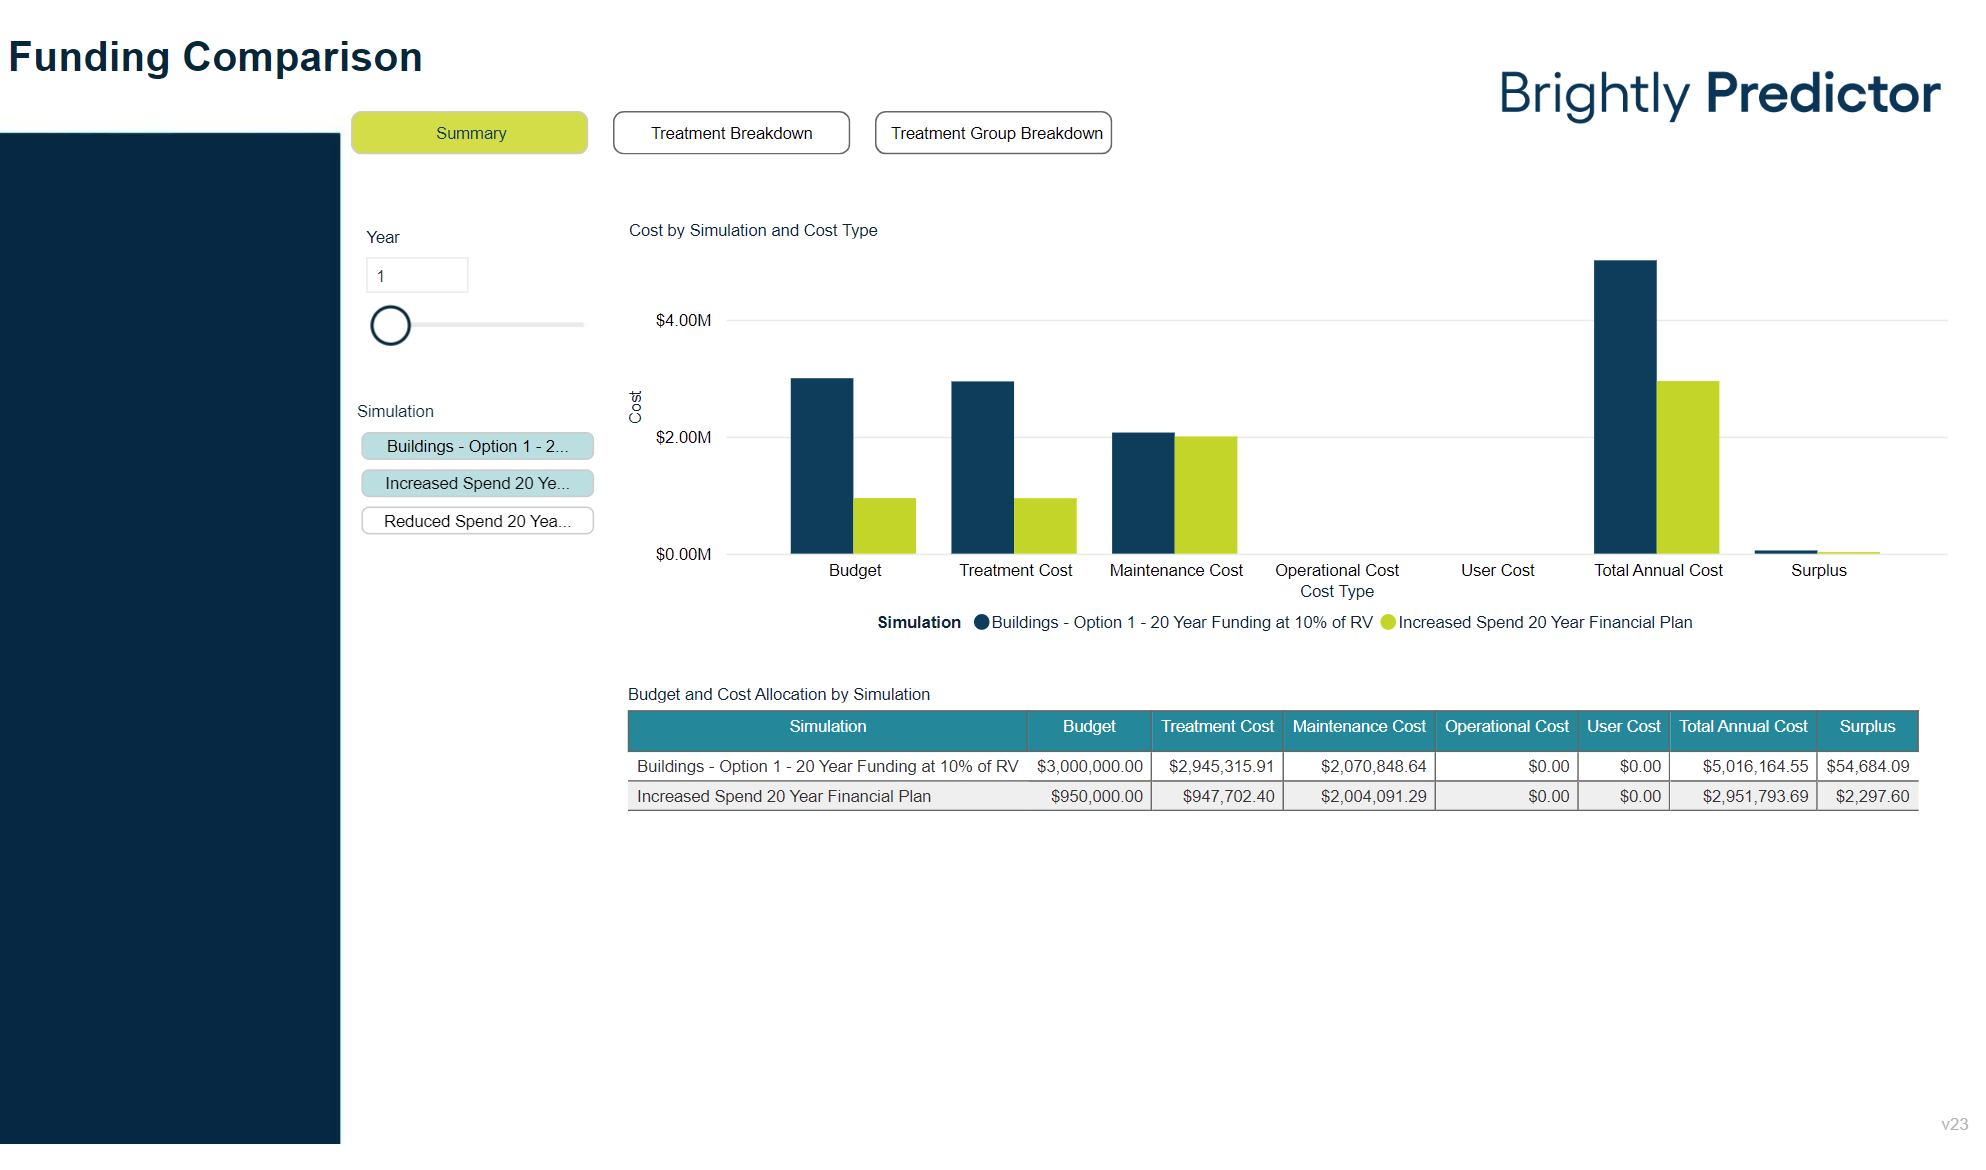
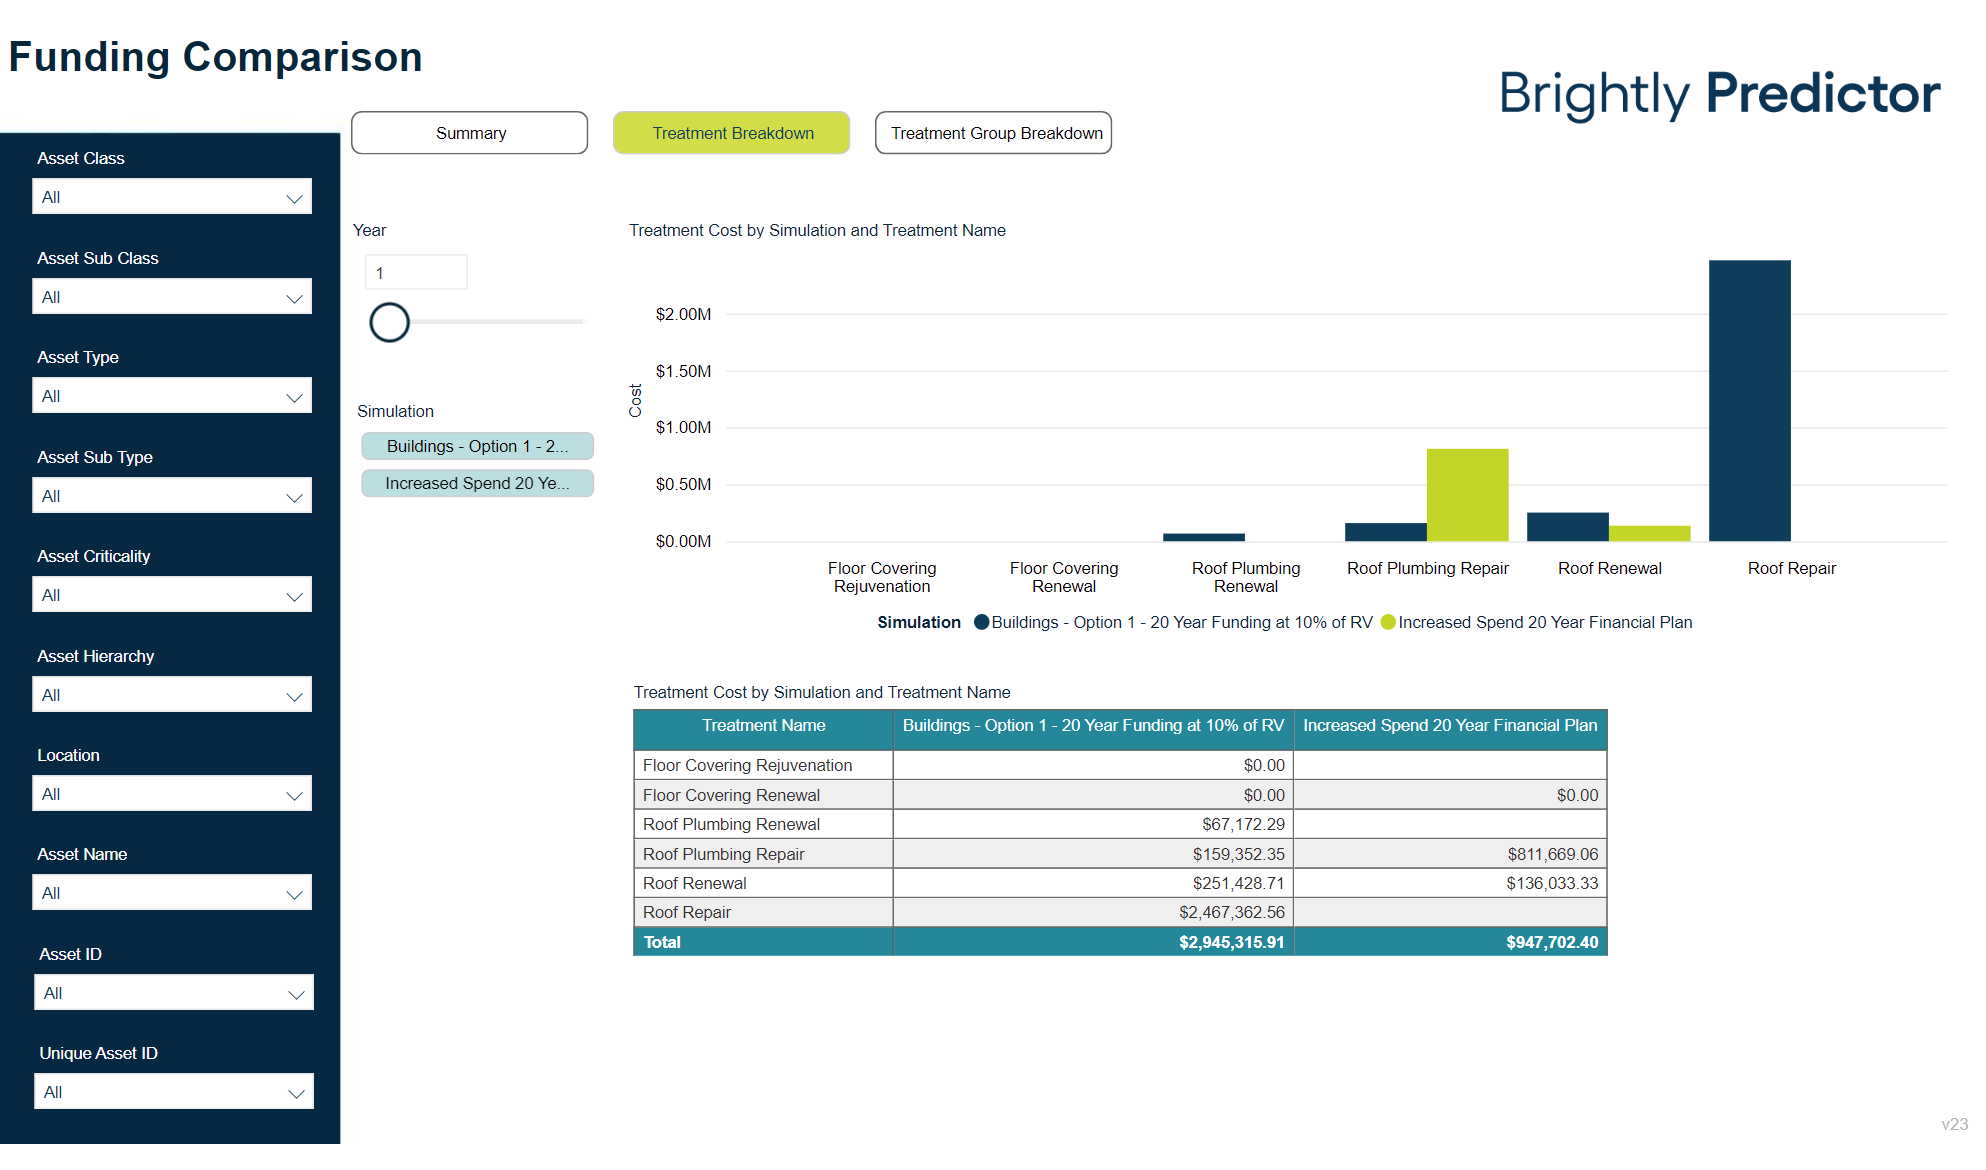
Users can then drill deeper by selecting the Treatment Breakdown or Treatment Group Breakdown buttons and also view the different number of years by moving the value slider or entering a number under the Year field.